
Network Monitoring and Logging with pfSense, Snort, and Splunk
ARTICLES


Monitoring and logging network traffic is one of the most critical aspects of cybersecurity. Without visibility into what’s happening on your network, you’re flying blind in a world full of threats. In this guide, I’ll walk you through configuring pfSense, Snort, and Splunk to create a powerful network monitoring and intrusion detection system. We’ll cover everything from setting up basic logging to using Splunk to analyze potential attacks.
Why Monitor Network Traffic?
Imagine your network as a busy city. Data packets are like cars, moving from one point to another. Without monitoring, you wouldn’t know which vehicles are authorized or which ones are breaking the rules. Tools like pfSense, Snort, and Splunk help you track and control this traffic, ensuring your network remains secure and functional.
Setting Up Basic Monitoring and Logging
The first step in any monitoring system is collecting data. In this section, I configured pfSense to log network events and set up Snort to detect potential intrusions.
Step 1: Configuring pfSense Logging
pfSense is a firewall and router solution that also provides excellent logging capabilities. Here’s how I set up logging:
1. Access the WebGUI
I opened a browser and navigated to http://172.30.0.1.
Logged in with default credentials: admin/pfsense.
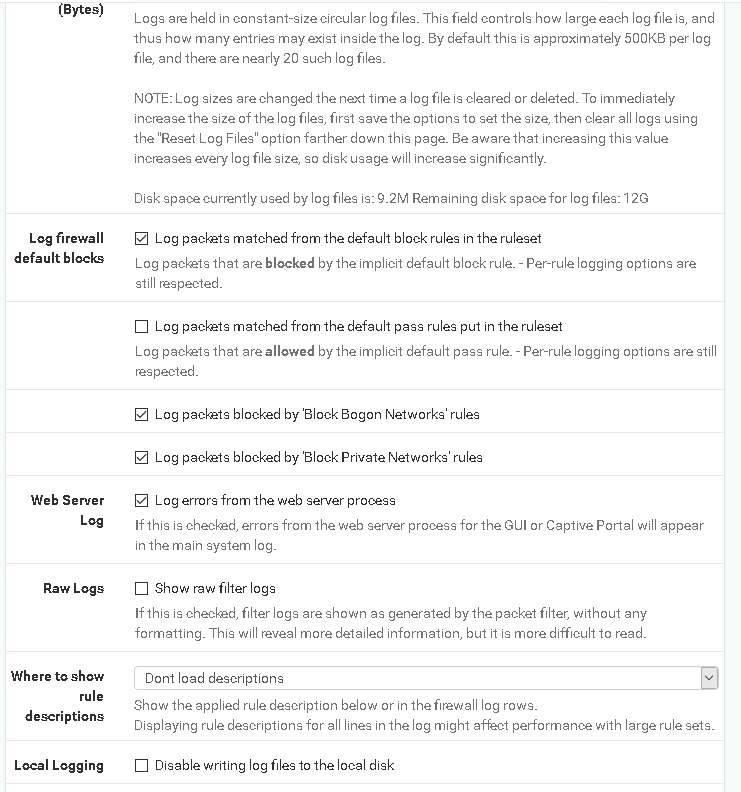
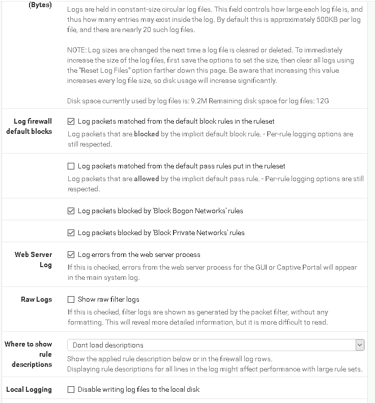
2. Enable Firewall Logging
I went to Status > System Logs > Settings.
Enabled Log packets matched from the default block rules.
This ensures that all traffic blocked by the firewall is logged.
3. Limit Log Size
I set the number of log entries to 250 to make logs manageable.
4. Configure Remote Logging
Enabled Remote Logging and entered the IP address and port of the Kiwi Syslog Server:
172.30.0.2:514.
This forwards pfSense logs to a centralized server for easier analysis.
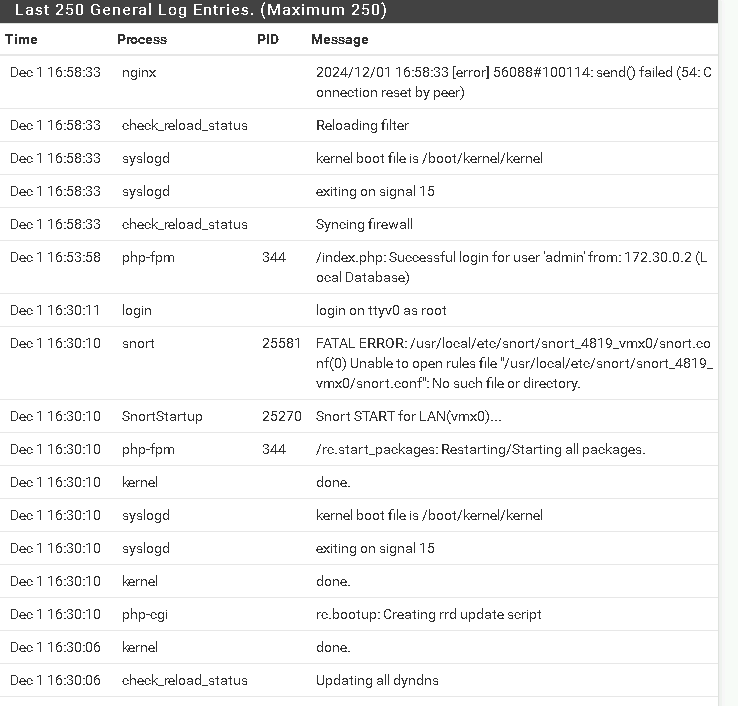
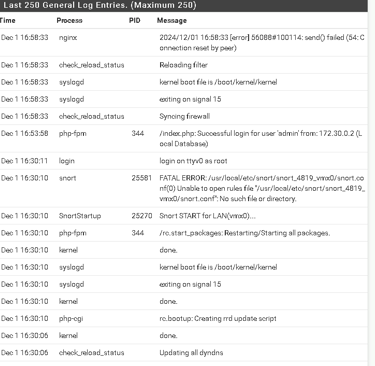
Logs are the foundation of network monitoring. By enabling logging, I ensured every blocked packet and suspicious activity was recorded for future analysis.
Step 2: Setting Up Snort for Intrusion Detection
Snort is an intrusion detection system (IDS) that analyzes network traffic for malicious behavior. Here’s how I configured it:
1. Install and Activate Snort
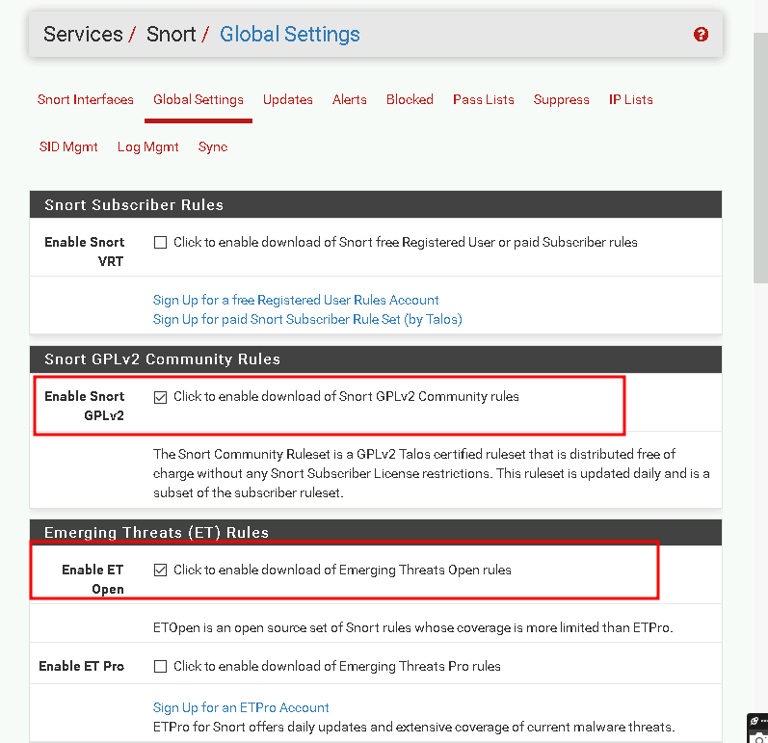
I went to Services > Snort > Global Settings.
I enabled the Snort GPLv2 Community Rules and ET Open Rules for broad attack coverage.
2. Configure Pass Lists
Created a pass list called passlist_LAN_IDS to avoid false positives for trusted LAN devices.
3. Enable Snort on the LAN Interface
Assigned the LAN interface to Snort and enabled detection.
Activated specific rules like:
emerging-icmp_info.rules (for ICMP traffic analysis).
emerging-scan.rules (to detect network scans).
4. Test Intrusion Detection
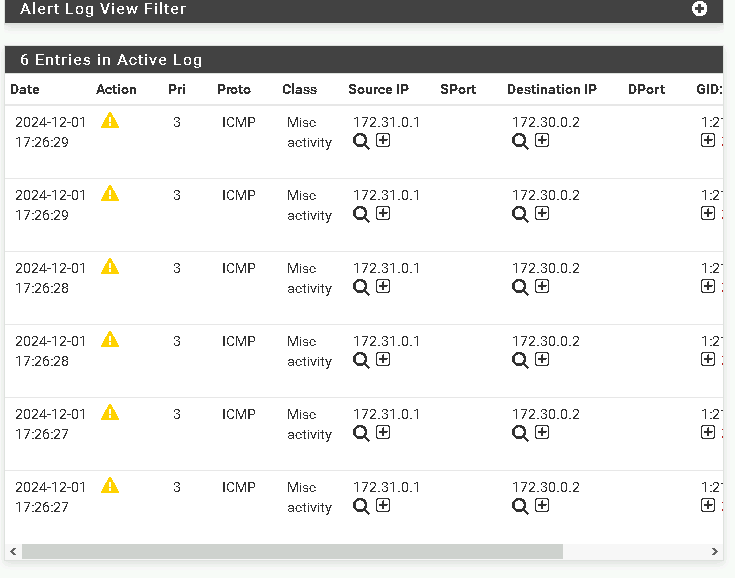
Used the Diagnostics > Ping tool to send ICMP packets from the DMZ to the LAN.
Verified that Snort logged the pings as suspicious events.
Why This Matters:
Snort acts as your network’s security guard, detecting and logging suspicious activities like scans or unauthorized access attempts.
Step 3: Forward Logs to Kiwi Syslog Server
Centralizing logs makes it easier to analyze events from multiple sources. Here’s how I forwarded logs to the Kiwi Syslog Server:
1. Configure pfSense for Remote Logging
In the Remote Logging Options, added the syslog server IP (172.30.0.2:514) to forward firewall and system logs.
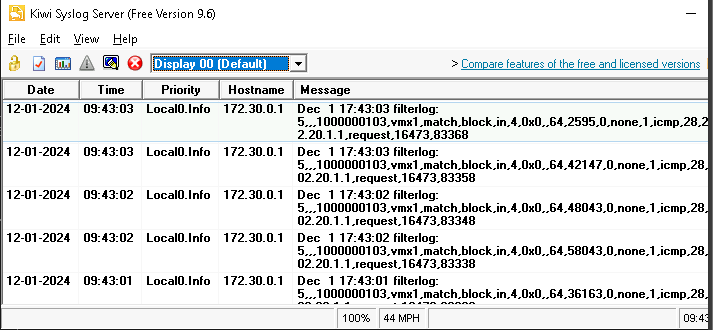
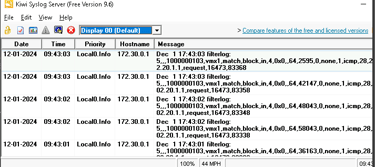
2. Verify Logs in Kiwi
Opened the Kiwi Syslog application and confirmed logs were being received from pfSense in real time.
Why This Matters:
Centralized logging helps you monitor your entire network from a single location, saving time and effort.
Section 2: Advanced Monitoring with Splunk
For deeper insights and advanced event management, I integrated Splunk into the monitoring system. Splunk allows you to search, query, and visualize logs for effective threat analysis.
Step 1: Setting Up Splunk
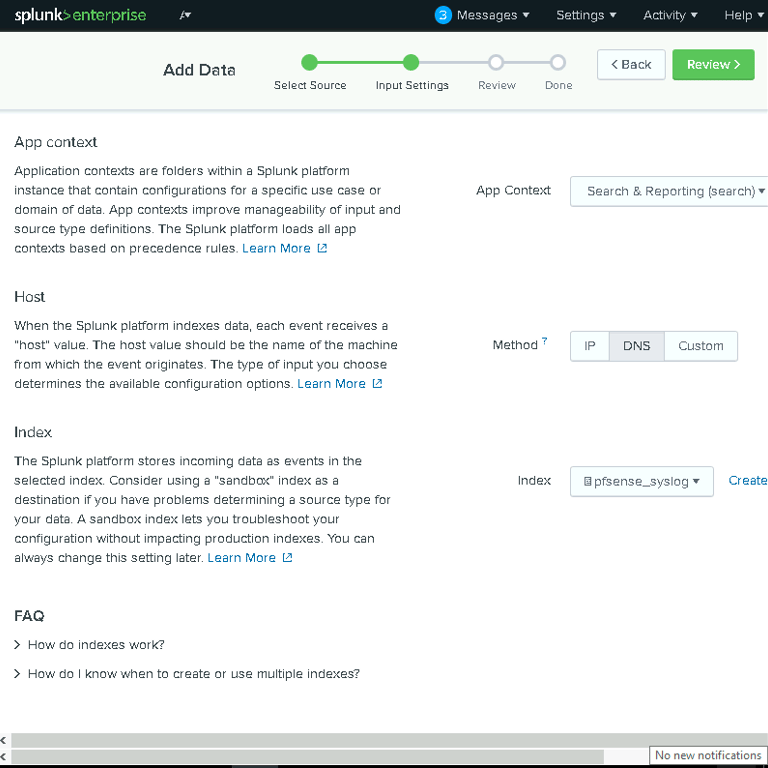
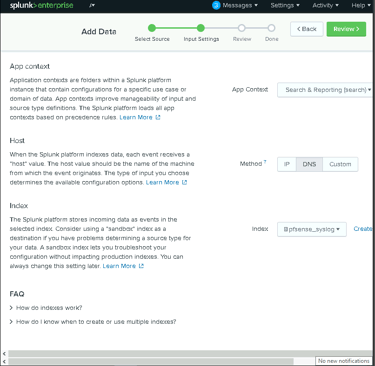
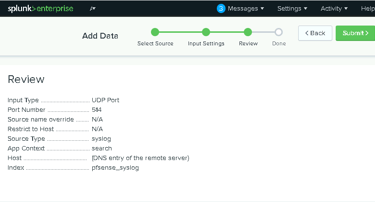
1. Add pfSense Logs to Splunk
On the Splunk dashboard, clicked Add Data > Monitor > TCP/UDP.
Configured Splunk to listen on UDP port 514 for syslog data from pfSense.
Named the index pfsense_syslog for easy identification.
2. Verify Data Ingestion
Searched for indexed events in Splunk’s Search & Reporting app to confirm that logs were being received.

Why This Matters:
Splunk transforms raw logs into meaningful insights, helping you identify patterns and anomalies quickly.
Step 2: Simulating and Detecting an Attack
To test the effectiveness of the monitoring system, I simulated a network attack using Nmap.
1. Perform a Network Scan
Used a Kali Linux machine to run the following Nmap command
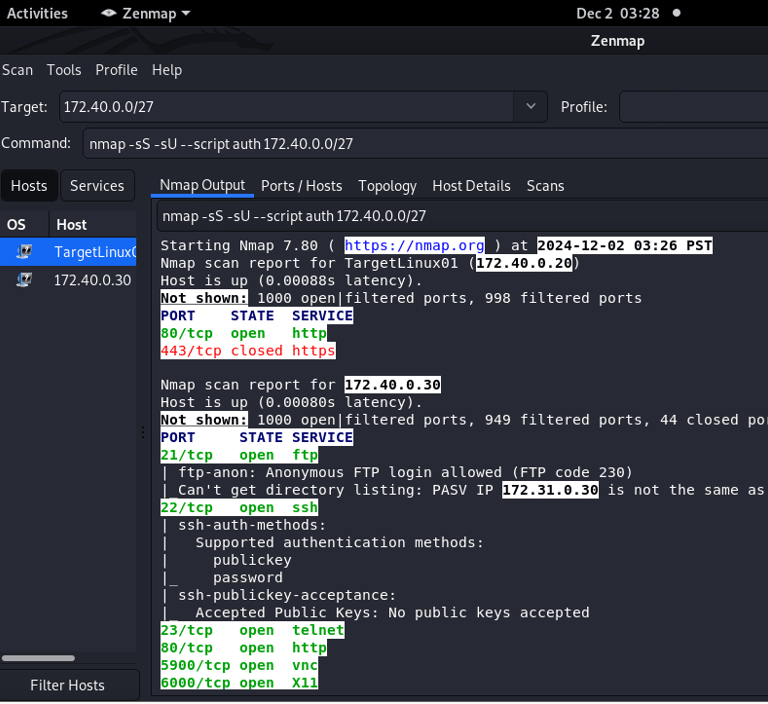
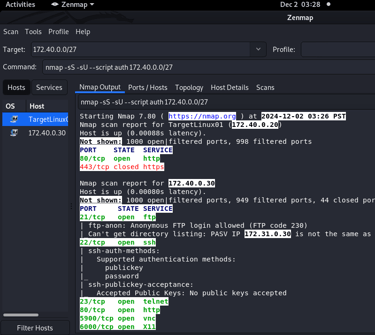
This scan sent a mix of TCP and UDP probes to identify open ports and services.
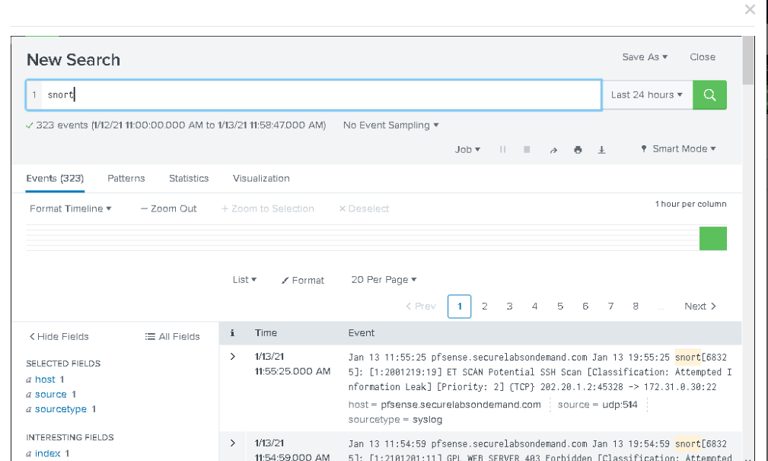
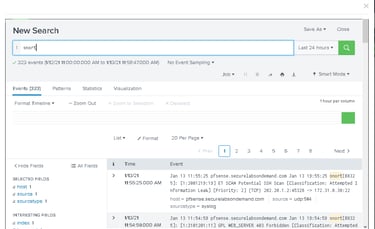
2. Analyze Alerts in Splunk
In Splunk, I searched for Snort to filter intrusion detection events.
Confirmed that Snort detected and flagged the Nmap scan as suspicious.
By combining pfSense, Snort, and Splunk, I built a strong monitoring system that logs, detects, and analyzes network traffic. Whether you’re managing a home network or a corporate environment, these tools offer a powerful solution for keeping your network secure.