
Memory Forensics — Catching Persistence in RAM with Volatility
HACKING-TUTORIALSHACKS


The attacker didn’t drop malware on disk. No .exe, no obvious scheduled task. Yet every morning at exactly 9:00 AM, a hidden process called “OneDriveHelper” would beacon out to a suspicious IP address.
I suspected this was fileless malware, something injected into memory. So I pulled a live memory dump from the compromised Windows 10 system using winpmem. What followed was a deep dive into the volatile evidence left in RAM.
This is where many defenders stop short, they know disk forensics, but not RAM. Today’s blog walks you through a full memory forensics workflow using Volatility 3, the powerful open-source framework used by DFIR pros worldwide.
Step 1 — Inspect the Running Processes
We start with pslist to reveal suspicious processes. Here's what we find:
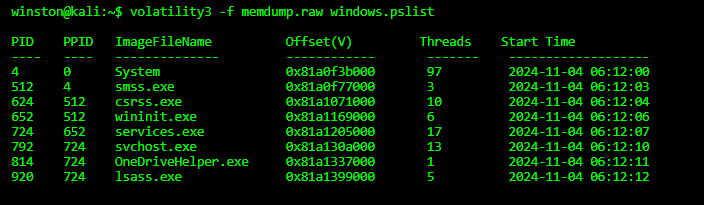
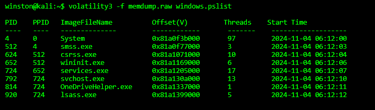
The process OneDriveHelper.exe has no valid parent (not signed), runs from an odd memory offset, and is not a default Windows process. It’s likely injected or reflectively loaded.
Step 2 — Find Autoruns in RAM with printkey
Now we pivot to the registry hive still stored in memory. We dump the contents of HKCU\Software\Microsoft\Windows\CurrentVersion\Run.
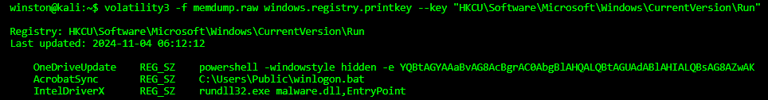
Three registry keys were found. All three are signs of persistence:
One launches encoded PowerShell
Another runs a hidden batch file
A third uses rundll32 to load a custom DLL
These are classic attacker footholds — easy to miss in real time but preserved in memory.
Step 3 — Dump the Malicious Memory Region
We go even further by dumping the OneDriveHelper.exe memory region using Volatility's memdump plugin. Then we run strings and find artifacts like:
X-Agent v3.5
task_schedule /10min