
Mastering Network Forensics: A Step-by-Step Guide to Traffic Analysis and Router Investigation
ARTICLES


In today's interconnected world, network forensics is essential for detecting malicious activities and securing critical infrastructure. This blog will take you through a detailed forensic investigation involving traffic analysis using Wireshark and router log examination to uncover potential vulnerabilities and malicious activities.
By following this step-by-step guide, you’ll learn how to:
Use Wireshark to capture and analyze network traffic.
Extract key evidence from router logs, such as ARP tables, IP routes, and configurations.
Develop a structured approach to network forensics.
Why Network Forensics Matters
Network forensics is a specialized field that focuses on capturing, analyzing, and preserving network traffic to uncover suspicious or malicious activities. This skill is critical for:
Investigating security breaches.
Monitoring suspicious activity.
Tracing the source of attacks.
Collecting evidence for legal or regulatory purposes.
This blog is based on a hands-on lab experience where I conducted forensic investigations on a network using Wireshark and router tools. Let’s dive in.
Capturing and Analyzing Traffic with Wireshark
Wireshark is one of the most powerful tools for network forensics. It allows you to capture live network traffic and analyze it for suspicious patterns or unauthorized data flow.
Step 1: Starting Wireshark
Open Wireshark from the desktop.
Select the Student interface (your capture interface).
Enable Promiscuous Mode so Wireshark captures all traffic passing through the network, not just traffic addressed to your device.
Click Start to begin capturing packets.
Step 2: Generating Traffic for Analysis
To generate network traffic, I opened Firefox and accessed a sample webpage hosted on a Kali system at IP 202.20.3.10. Once the webpage loaded, I closed the browser to stop generating traffic.
Step 3: Stopping the Capture
After generating traffic:
Click the Stop button on the Wireshark toolbar.
Organize packets chronologically by selecting Time Display Format > Date and Time of Day from the View menu.
Step 4: Applying Filters
To make sense of the captured traffic, I applied several filters in Wireshark to isolate relevant data:
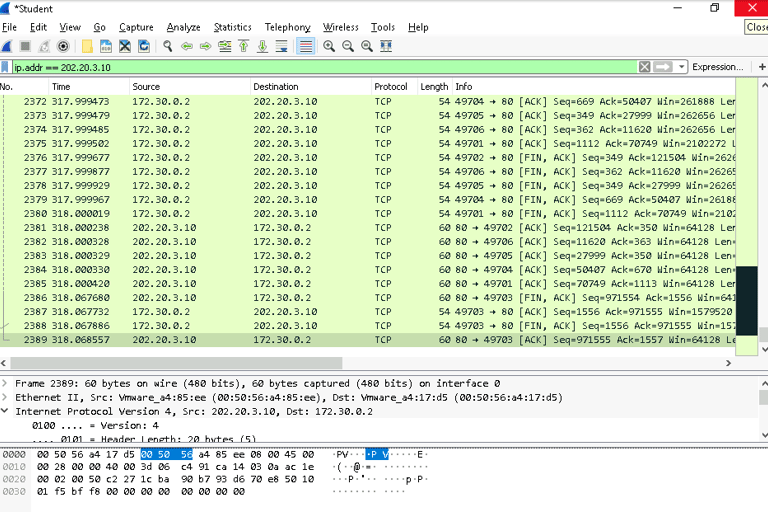
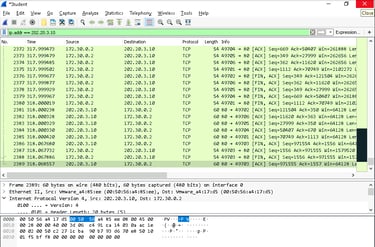
IP Filter:
Use ip.addr == 202.20.3.10 to view traffic to and from the web server.
Port Filter:
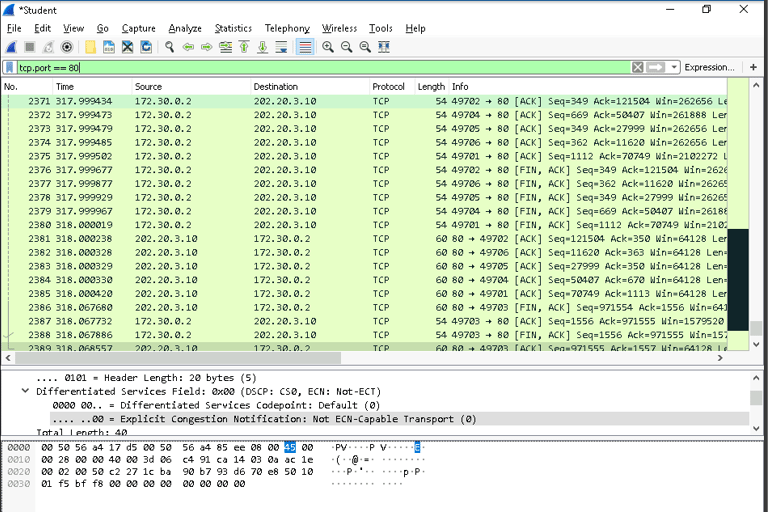
Use tcp.port == 80 to display HTTP traffic.
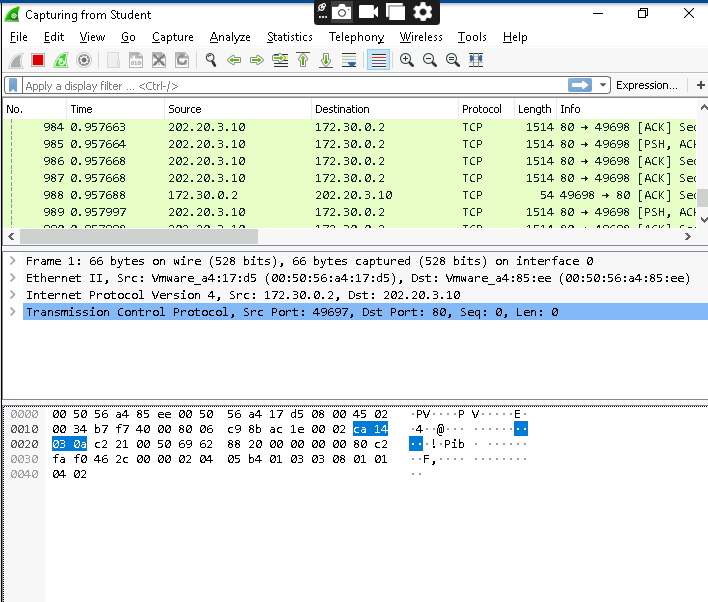
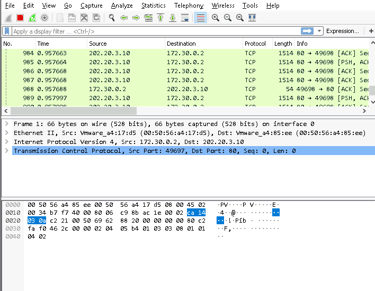
TCP Push Flags:
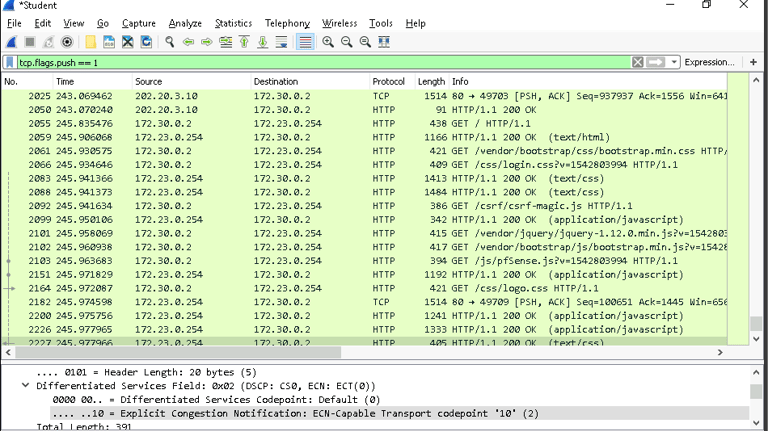
Use tcp.flags.push == 1 to focus on TCP packets with the push flag, which often contain useful data payloads.
HTTP Protocol Filter:
Use http to isolate all HTTP traffic.
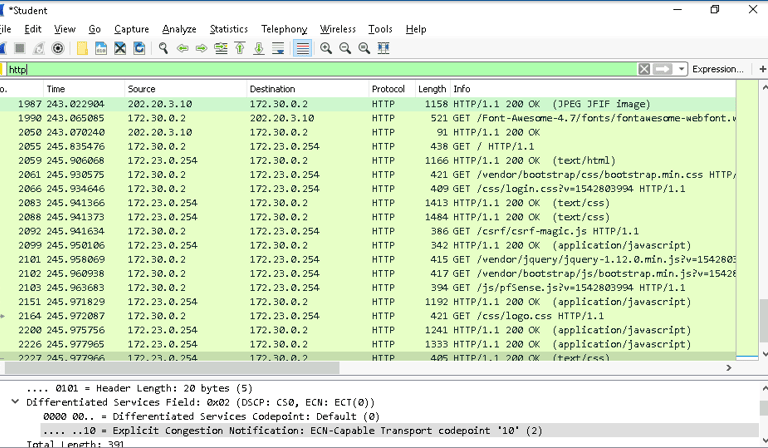
Insights Gained from Wireshark
IP Analysis: The IP filter revealed the server responding to requests, confirming its active status.
HTTP Traffic: The HTTP filter highlighted specific GET requests and responses, helping us understand the type of communication.
TCP Analysis: Examining TCP push flags allowed me to view data payloads that could contain sensitive or malicious content.
Wireshark’s versatility made it possible to pinpoint suspicious traffic and trace the origin of specific activities.
Investigating Router Logs
Routers play a critical role in network infrastructure, and their logs often hold essential forensic data. Using SSH and command-line tools, I examined the router’s configuration and traffic information.
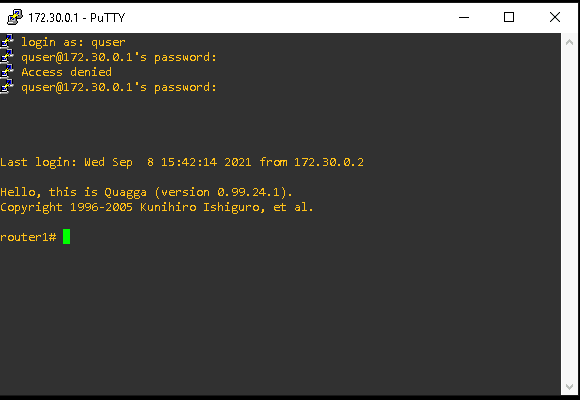
Step 1: Accessing the Router
I connected to the router using PuTTY with the following details:
Hostname/IP Address: 172.30.0.1
Username: quser
Password: password
This allowed me to access the router’s command-line interface for deeper analysis.
Step 2: Running Forensic Commands
Here are the key commands I used and the forensic insights gained:
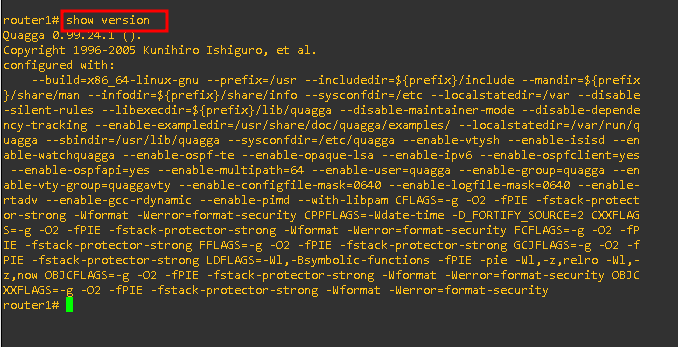
show version:
This command displayed details about the router’s hardware and software configuration, including its operating system version.Forensic Insight: Identifies potential vulnerabilities based on outdated firmware.
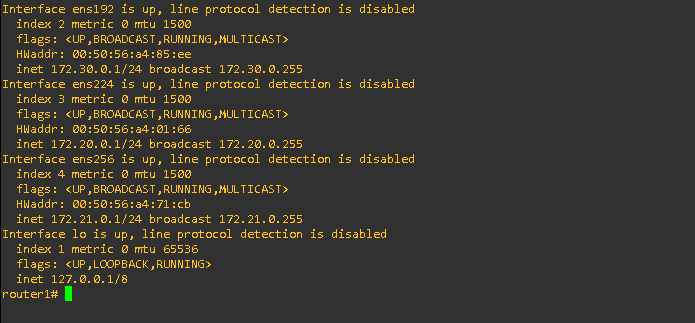
show interface:
This command provided details about the router’s interfaces, including their IP and MAC addresses.
Forensic Insight: Revealed all active and inactive interfaces, helping to identify suspicious network paths.
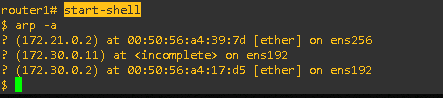
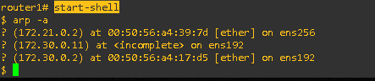
start-shell and arp -a:
Accessing the router’s shell allowed me to view the ARP table, showing mappings between IP and MAC addresses.
Forensic Insight: ARP tables can reveal ARP spoofing attempts or unauthorized devices.
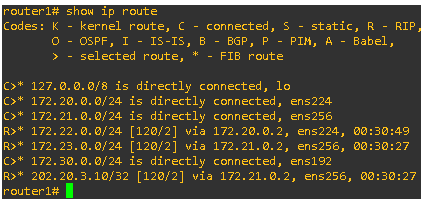
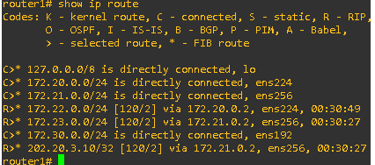
show ip route:
This command displayed the router’s IP routing table.
Forensic Insight: Mapped the network topology and identified potential malicious routes.
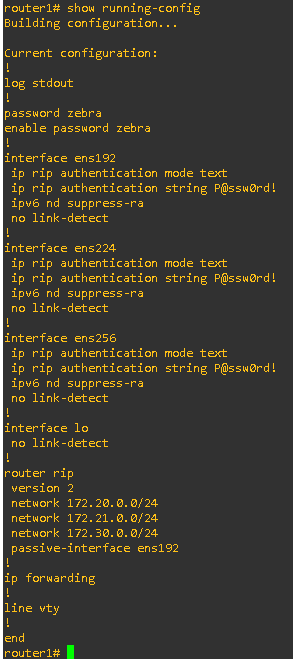
show running-config:
This command provided the current configuration of the router, including authentication and routing settings.
Forensic Insight: Any unauthorized changes in the running configuration could indicate tampering.

Key Insights from Router Logs
Configuration Analysis: Ensured that router configurations matched baseline settings and identified any anomalies.
Routing Table: Helped trace network paths and detect suspicious routes.
ARP Table: Highlighted devices connected to the network and any potential spoofing attempts.
Lessons Learned
Wireshark’s Power: Filtering traffic by IP, port, and protocol makes it easy to identify specific activities in a sea of data.
Router Logs Are Critical: Logs provide a wealth of information about network topology, connected devices, and configuration changes.
Structured Approach is Key: A systematic process ensures no evidence is missed and findings are well-documented.